Awning is 100% free. Sign up to unlock all insights & data
By Mercurywoodrose - Own work, CC BY-SA 3.0, https://commons.wikimedia.org/w/index.php?curid=99144240
Hayward, California Airbnb Market Data
- Overview
- Top Airbnbs
- Rates
- Occupancy
- Revenue
Rates
The average airbnb average daily rate in Hayward, California is $133 for entire homes, for private rooms, and for shared rooms. These average daily rate numbers exclude cleaning fees.
Airbnb Average Daily Rates in Hayward, CA
Entire HomeEntire Home$133
Private RoomPrivate Room
Shared RoomShared Room
Monthly ADR Breakdown by Bedroom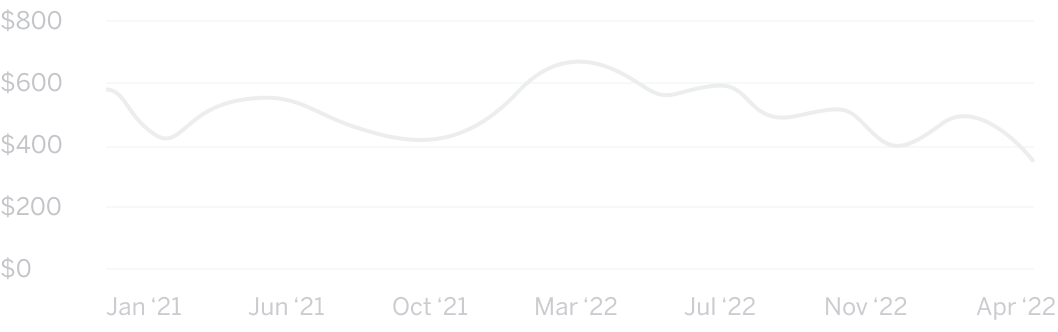
Log in to view the data
ADR Breakdown by Bedroom (last 12 months)
| Studio | |
| 1 bedroom | |
| 2 bedroom | |
| 3 bedroom | |
| 4 bedroom | |
| 5+ bedroom |
Map
❮
+
-
Map
All FiltersClear
All Filters
Bedrooms
-
Rating
-
Max. Radius
Maximum radius in miles. From 0.1 to 20 miles.
Min. Guest Reviews
From 0 to Unlimited reviews
ADR
-
Guests
-
Amenities
Either
With
Without
Parking
Pets allowed
Washer
Dryer
Kitchen
Pool
Hot Tub
Gym
Clear
Analyze any address and get Airbnb revenue, occupancy, and average daily rate estimates. Try out our Airbnb Estimator.Analyze any address using our Airbnb Estimator.