Awning is 100% free. Sign up to unlock all insights & data
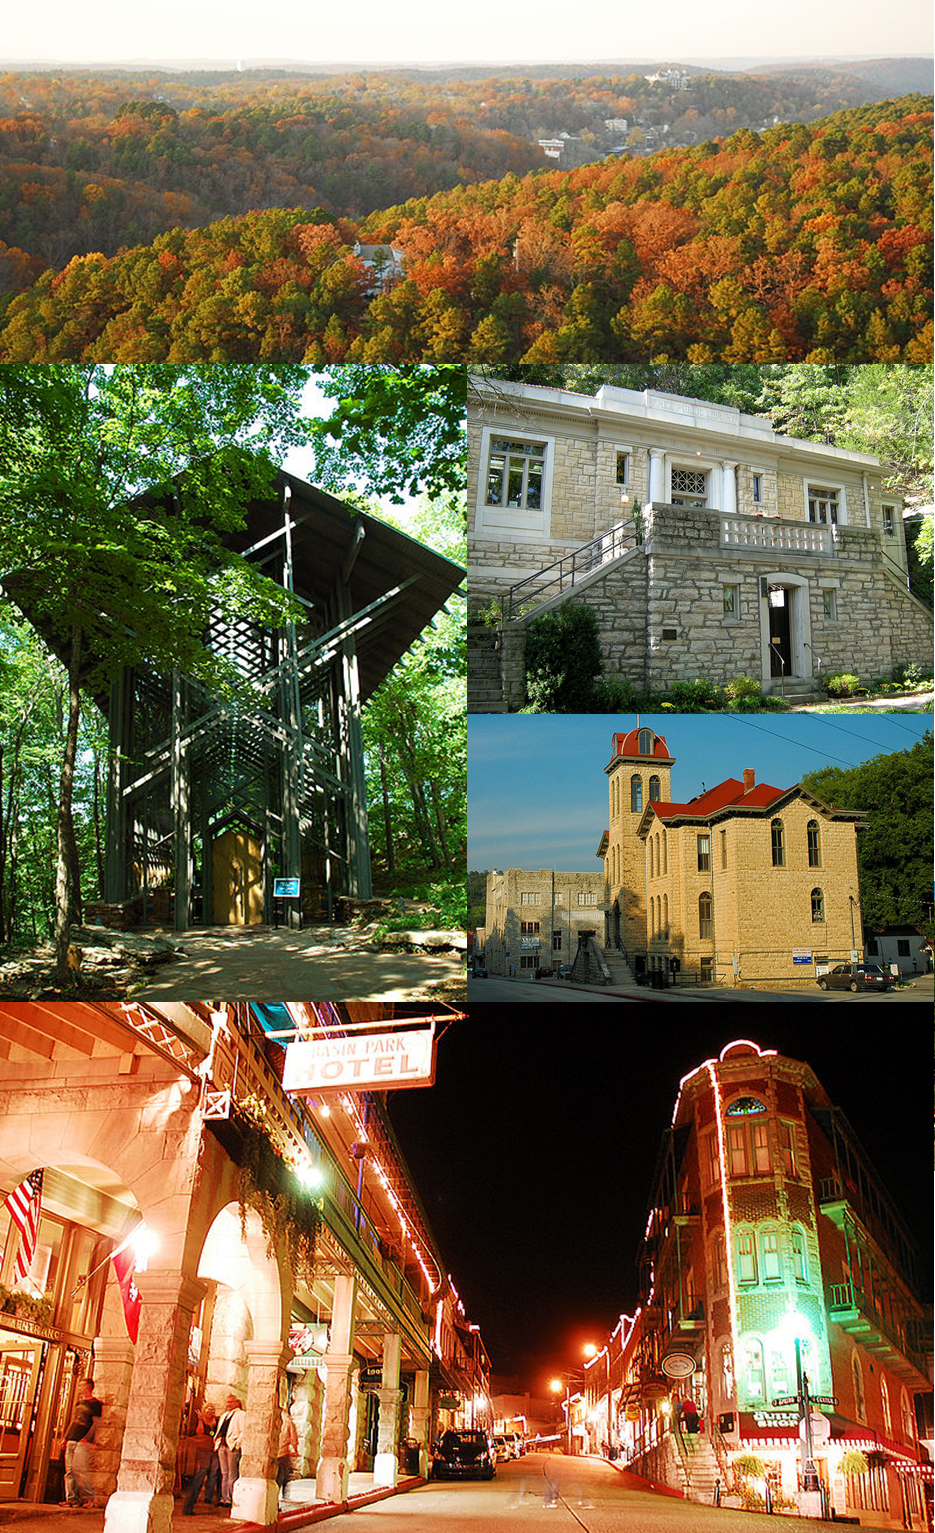
By User:Brandonrush, Clinton Steeds, User:Photolitherland, User:CZmarlin - File:Eurekaandsuch 372.jpgFile:Carnegie Public Library in Eureka Springs AR.jpgFile:Carroll county arkansas courthouse eureka springs.jpgFile:Eurekaandsuch 220.jpgFile:Thorncrown Chapel.jpg, CC BY-SA 3.0, https://commons.wikimedia.org/w/index.php?curid=30947559
Eureka Springs, Arkansas Airbnb Market Data
- Overview
- Top Airbnbs
- Rates
- Occupancy
- Revenue
Occupancy
The average airbnb occupancy rate in Eureka Springs, Arkansas is 53.0% for entire homes.
Average Airbnb Occupancy in Eureka Springs, AR
Entire HomeEntire Home53%
Private RoomPrivate Room
Shared RoomShared Room
Expect to see limited or no data due to the small number of airbnbs in this market.
Monthly Occupancy Breakdown by Bedroom
Log in to view the data
Occupancy Breakdown by Bedroom (last 12 months)
| Studio | |
| 1 bedroom | |
| 2 bedroom | |
| 3 bedroom | |
| 4 bedroom | |
| 5+ bedroom |
Map
❮
+
-
Map
All FiltersClear
All Filters
Bedrooms
-
Rating
-
Max. Radius
Maximum radius in miles. From 0.1 to 20 miles.
Min. Guest Reviews
From 0 to Unlimited reviews
ADR
-
Guests
-
Amenities
Either
With
Without
Parking
Pets allowed
Washer
Dryer
Kitchen
Pool
Hot Tub
Gym
Clear
Analyze any address and get Airbnb revenue, occupancy, and average daily rate estimates. Try out our Airbnb Estimator.Analyze any address using our Airbnb Estimator.